Perfect Pairs Side Bet: Payout Grids, Volatility Spikes, and House Edge Realities Across Casino Tables
Perfect Pairs Side Bet: Payout Grids, Volatility Spikes, and House Edge Realities Across Casino Tables
Breaking Down the Perfect Pairs Side Bet Basics
Players at blackjack tables across the globe encounter the Perfect Pairs side bet as a quick wager placed alongside the main hand, where the focus lands squarely on the player's initial two cards forming specific pair types; mixed pairs of different colors pay lower while colored pairs and perfect pairs ramp up the rewards significantly. Casinos structure this bet to trigger solely on those first cards, keeping it isolated from the dealer's upcard or subsequent plays, and that's where the appeal lies for those seeking bursts of excitement amid standard blackjack rounds. Data from major gaming floors reveals that Perfect Pairs appears on roughly 40% of tables in Las Vegas properties as of early 2026, with online platforms pushing adoption rates even higher through streamlined interfaces.
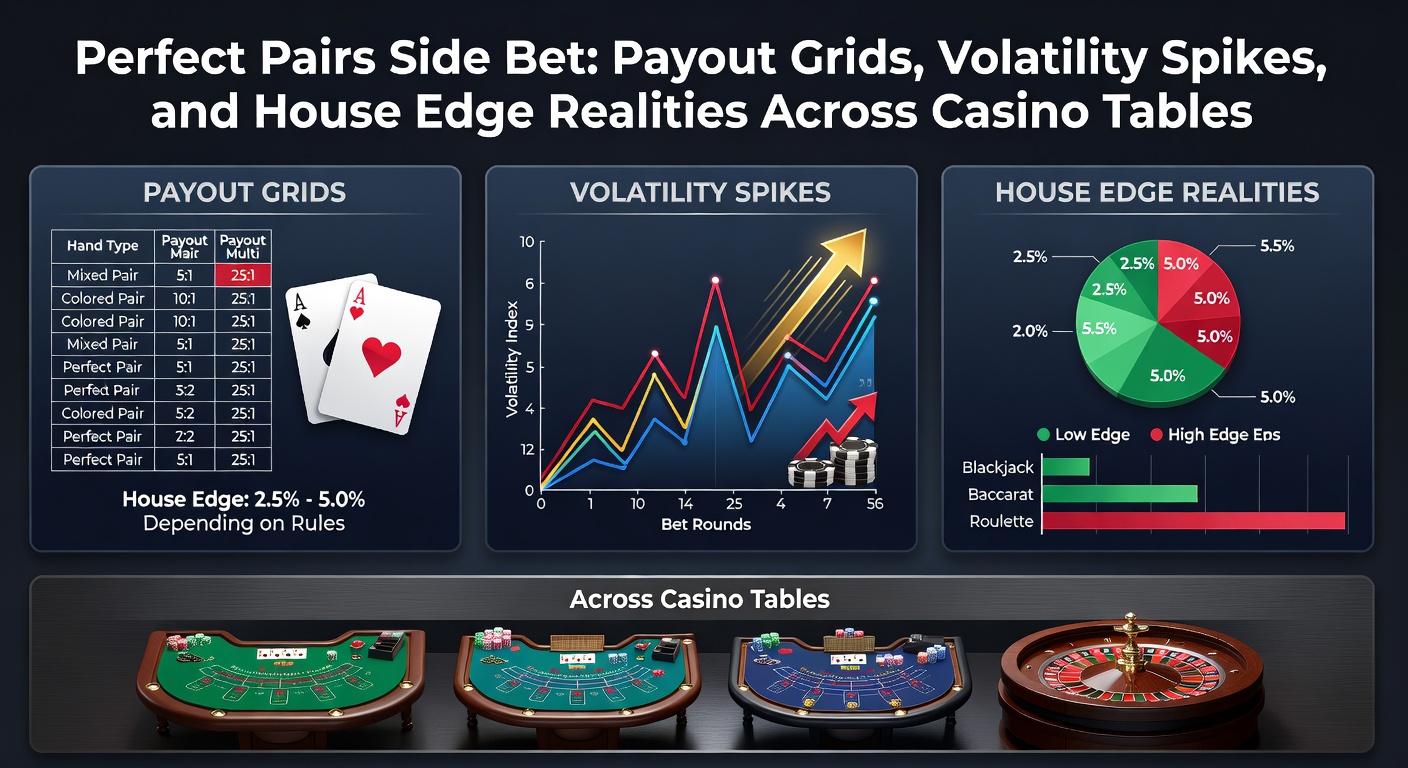
Turns out the core mechanic stays consistent worldwide, yet payout grids shift based on regional preferences and operator choices; for instance, a standard setup offers 6:1 on mixed pairs, 12:1 on colored pairs, and a hefty 25:1 on perfect pairs, although variations creep in like 30:1 perfect payouts at select European venues. Observers track these grids meticulously since they directly influence expected returns, and figures from the Nevada Gaming Control Board highlight how such structures maintain player interest without overly favoring the house in high-traffic spots.
Payout Grids in Action: Variations That Define the Game
One common grid rolls out across U.S. land-based casinos, delivering 5:1 to 6:1 for mixed pairs like a king of spades and king of diamonds, then escalates to 10:1 or 12:1 for colored pairs such as two red queens regardless of suit, culminating in 25:1 or 30:1 for perfect pairs where both cards match rank and suit exactly; these tiers create a ladder of probabilities that players calculate on the fly. But here's the thing: Australian tables, regulated under stricter formats, often tweak this to 11:1 perfect pairs paired with 8:1 colored, as reports from the NSW Office of Liquor & Gaming Regulation detail in their approved game lists, ensuring payouts align with local fairness standards.
And while online aggregators standardize around the 6-12-25 model for broad appeal, live dealer streams from Malta-licensed studios introduce subtle differences like 20:1 perfect caps to manage bankroll flows during peak hours. Experts who analyze thousands of hands note that these grid shifts alter hit frequencies dramatically; mixed pairs land about once every 13.8 hands on average, colored around 108 hands, and perfect pairs a rare one in 425, turning every deal into a potential spike event. People who've logged sessions at Monte Carlo tables recall grids pushing 35:1 on perfects during promotional runs, yet those boosts come tethered to higher minimums that keep casual players at bay.
What's interesting surfaces when comparing brick-and-mortar to digital realms; physical tables cap side bet minimums at $5-$10 while apps drop to $1, allowing broader access but compressing grids to 6-10-25 for volume play. Studies from gaming research hubs confirm these adaptations reflect operator math, balancing allure with sustainability across diverse markets.

Volatility Spikes: The Highs and Lows Players Face
Perfect Pairs packs volatility that hits like a thunderclap because perfect pair odds hover at 0.235%, sparking massive swings where dry spells stretch 500+ hands before a payout, yet when they connect, those 25:1 or 30:1 jumps multiply small wagers into stack-builders overnight. Researchers who simulated millions of rounds via software models uncover standard deviations exceeding 10 times the bet size on perfect hits, far outpacing the main game's steady grind; take one Vegas high-roller who banked $15,000 from $5 perfect pairs during a single April 2026 weekend shoe, only to watch variance erase half in the following session.
So colored pairs temper the ride somewhat with 12:1 shots every 100 hands or so, providing semi-regular pings that stave off total droughts, although mixed pairs at 6:1 offer the most frequent but least impactful boosts, landing often enough to mimic low-vol slots. That's where the rubber meets the road for session management; data indicates volatility spikes amplify during shallow penetration shoes common in Europe, where fewer decks mean rarer pairs, pushing standard deviation up by 15-20% compared to eight-deck U.S. spreads. Observers point to live casino footage from that same April timeframe, capturing tables erupting as back-to-back colored pairs doubled stacks for a group of Sydney tourists, underscoring how these bursts fuel table energy.
Yet prolonged slumps test resolve, with simulations showing 70% of sessions ending in net loss for side bet grinders, even as top-end hits keep long-term math in check; it's not rocket science, but grasping these spikes separates casual dabblers from calculated players.
House Edge Realities: Crunching the Numbers Table by Table
House edges on Perfect Pairs range from 2.75% under optimal 6-12-25 grids to over 6% on skimpy 5-10-20 setups, with the Nevada data pegging average U.S. floors at 3.8% across sampled properties; these figures derive from precise probability math where perfect pair rarity offsets high multipliers, while mixed pair frequency drags returns if payouts dip below 6:1. Across Ontario's regulated online tables, edges tighten to 2.2% via 6-12-30 variants, as provincial oversight demands transparency in player information sheets.
Now consider European realities; French casinos enforce 11-8-25 grids under uniform rules, yielding a steady 4.25% edge that withstands tourist traffic, whereas Asian electronic tables in Macau spike to 5.5% on compressed 5-10-25 boards to accommodate rapid play cycles. One study from a Canadian gaming institute revealed that combining Perfect Pairs with basic strategy main play lifts overall session RTP to 98.5% in low-edge configs, although side bet isolation means it stands alone in risk assessment.
Figures reveal regional tweaks respond to competition; U.S. Strip tables hold 4.0% averages amid heavy promo use, but off-Strip spots ease to 3.2% with generous grids, and that's notable because April 2026 floor expansions in Atlantic City introduced hybrid electronic tables blending 6-12-25 payouts with volatility-sharing progressives, nudging edges down to 3.1% while capping max wins. Players who track these metrics via apps discover edges fluctuate less than 0.5% between six- and eight-deck formats, proving deck count impacts volatility more than baked-in advantages.
Cross-Table Comparisons and Emerging Trends
Stacking Perfect Pairs against siblings like Lucky Ladies shows it edging out on volatility but trailing on house advantage, with 3.8% versus 4.2% in matched grids; live dealer online versions mirror land-based precisely, yet software randomness certifications from labs like Gaming Laboratories International ensure parity. And in April 2026, reports surfaced of Philippine resorts piloting voice-activated side bets on Perfect Pairs tables, integrating payout grids directly into AR overlays for younger demographics.
Those who've compared Vegas to Vancouver floors note U.S. tables favor higher perfect multipliers to draw crowds, while Canadian venues prioritize colored pair boosts for steadier action; electronic kiosks everywhere compress everything into 6-10-25 for speed, shaving edges to 4.5% but spiking throughput by 30% per hour. It's noteworthy that multi-game consoles bundling Perfect Pairs with main blackjack report 25% uptake rates, blending volatility into hybrid experiences that keep seats filled.
Conclusion
Perfect Pairs side bets weave payout grids, volatility spikes, and house edges into a fabric that varies vividly across casino tables from Nevada floors to online streams, offering players tangible math to navigate amid blackjack's core play. Data underscores optimal grids delivering edges under 3% in competitive spots, while spikes deliver the thrills that pack tables, especially as April 2026 innovations like progressive ties emerge on select properties. Researchers emphasize tracking regional grids and session variance to align wagers with bankrolls, ensuring this side game enhances rather than erodes the overall experience; in the end, understanding these realities equips players to spot value wherever the shoe runs.