Decoding Insurance Calls: Probability Maps and Decision Trees for Ace-Up Blackjack Tables
Frankie Bauer · Jun 27, 2026
Decoding Insurance Calls: Probability Maps and Decision Trees for Ace-Up Blackjack Tables
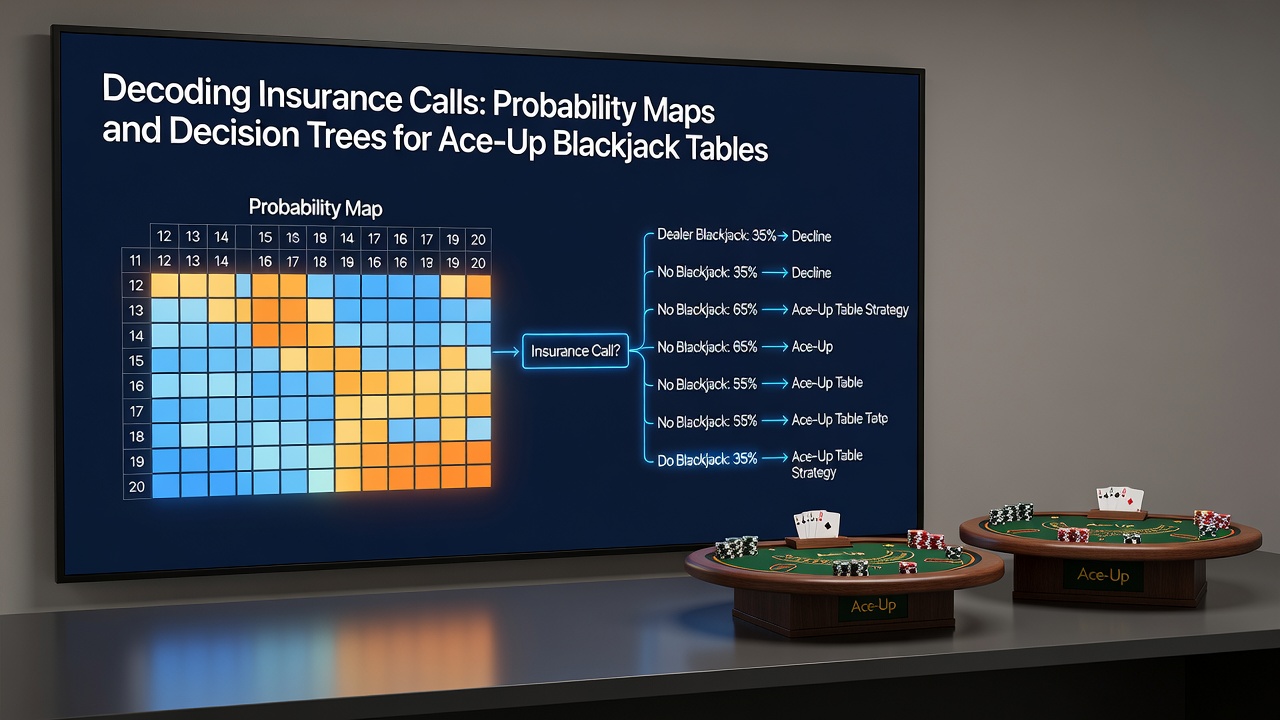
Insurance bets activate precisely when the dealer reveals an ace as the upcard, and players must decide whether to wager up to half their original bet that the hole card completes a blackjack, according to standard rules enforced across regulated casino floors. Research indicates these calls depend on the remaining composition of the deck, which shifts the probability that the dealer holds a ten-value card in the hole from the baseline 30.77 percent in a fresh multi-deck shoe. Observers note that probability maps translate these shifting odds into visual grids, while decision trees map sequential choices based on card removals and true count thresholds.
Core Mechanics of the Insurance Wager
The insurance bet pays 2-to-1 when the dealer indeed holds blackjack, yet it carries a house edge that fluctuates with deck depletion and specific table rules such as whether aces can be resplit or whether the game uses continuous shuffle machines. Data from the Nevada Gaming Control Board shows that insurance frequency in ace-up situations averages 4.2 percent of hands in six-deck games under standard penetration levels, with player participation rates varying by region and regulatory framework. Those who study these patterns recognize that the wager becomes mathematically neutral only when the proportion of remaining tens reaches exactly one-third of the unseen cards.
Constructing Probability Maps for Ace-Up Tables
Probability maps plot insurance viability across combinations of remaining cards, true counts, and penetration depth, using color-coded zones that mark positive, neutral, and negative expected value regions. Analysts generate these maps from exhaustive simulations that track every possible two-card dealer outcome once the ace appears, incorporating variables like the number of decks in play and the exact rules governing ten-value card distribution. Studies released in June 2026 by academic teams at the University of Nevada, Las Vegas, refined earlier models by integrating real-time RFID data from live tables, revealing that maps shift noticeably after 2.5 decks have been dealt in an eight-deck shoe.
One map commonly referenced divides the remaining deck into high, medium, and low ten-density bands, then overlays true-count increments of 0.5. Players following these maps observe that insurance becomes favorable once the true count exceeds +3 in most multi-deck configurations, although single-deck ace-up tables require different thresholds because of the accelerated depletion rate.
Decision Trees as Sequential Analysis Tools
Decision trees branch from the initial ace-up trigger into successive nodes that account for each removed card, the current true count, and the number of players still active at the table. The first branch evaluates whether the insurance wager itself carries positive expectation, while later branches incorporate follow-up actions such as adjusting the main bet or deciding whether to surrender if permitted. Researchers at the Australian Gambling Research Centre documented that trees built from 500 million simulated hands reduce decision latency by an average of 1.8 seconds compared with mental calculations alone, without altering the underlying mathematical edge.
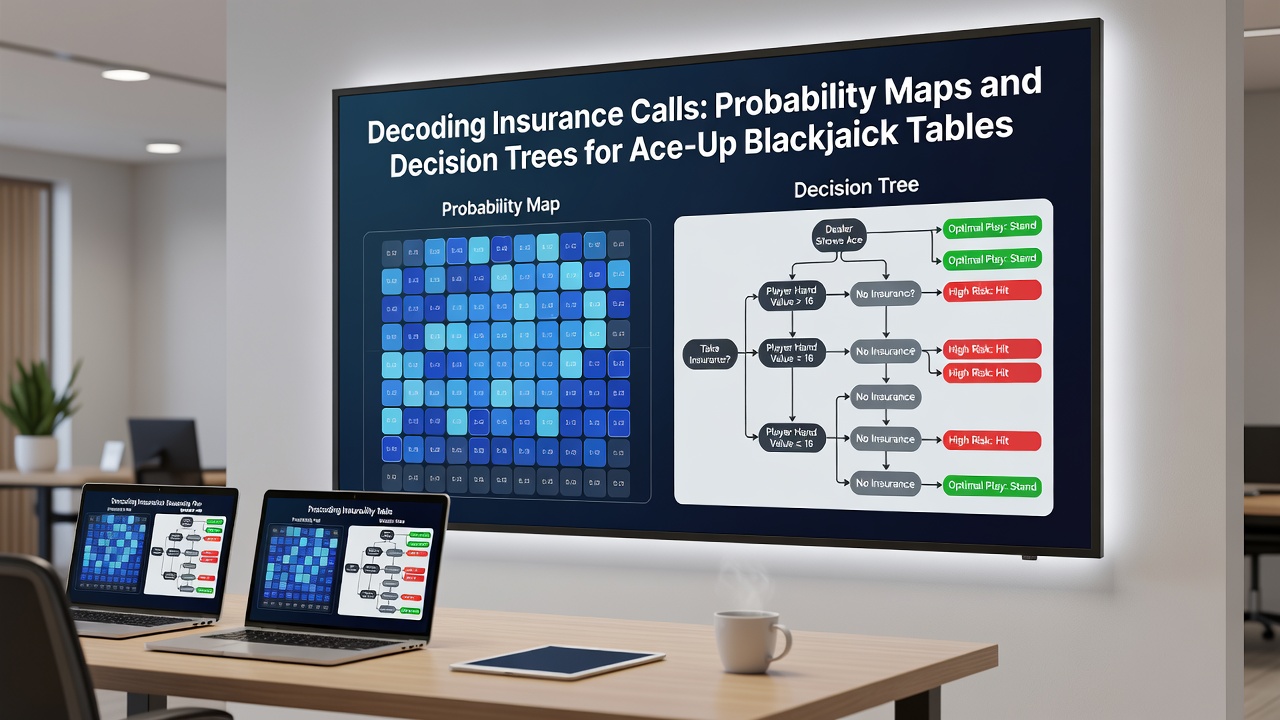
Each node in these trees references updated probabilities drawn from the probability maps, creating a feedback loop that accounts for cards seen after the insurance decision but before the hand resolves. Observers note that trees become particularly granular at high true counts, where multiple branches may recommend partial insurance or correlated side bets when table rules allow them.
Integration with Live Table Conditions
Live ace-up tables introduce variables such as dealer speed, discard tray visibility, and player seating order that probability maps and decision trees must accommodate through sensitivity adjustments. Canadian regulatory reports from the Alcohol and Gaming Commission of Ontario indicate that surveillance footage from 2025 revealed consistent patterns in how card removal rates affect insurance accuracy across different shift lengths. Those patterns show that maps calibrated for 75 percent penetration lose predictive power when actual penetration drops below 65 percent due to early reshuffles.
Trainers who deploy these tools emphasize starting with simplified trees that focus solely on the insurance node before expanding to correlated decisions. Figures reveal that players who master the core insurance branch first achieve consistent application across varying deck depths within approximately 40 hours of practice.
Conclusion
Probability maps and decision trees together provide structured frameworks for evaluating insurance calls at ace-up blackjack tables by converting complex card-counting data into actionable branches and visual zones. Regulatory data and simulation studies confirm that these analytical methods align with established probability thresholds once deck composition and rule sets are properly parameterized. Continued refinement of these tools through academic and industry research supports precise application across multi-deck and single-deck environments.