Blackjack Natural Hand Frequencies: Mapping Occurrences Across Varying Deck Setups in Simulation Studies
Avery Klein · Jul 29, 2026
Blackjack Natural Hand Frequencies: Mapping Occurrences Across Varying Deck Setups in Simulation Studies
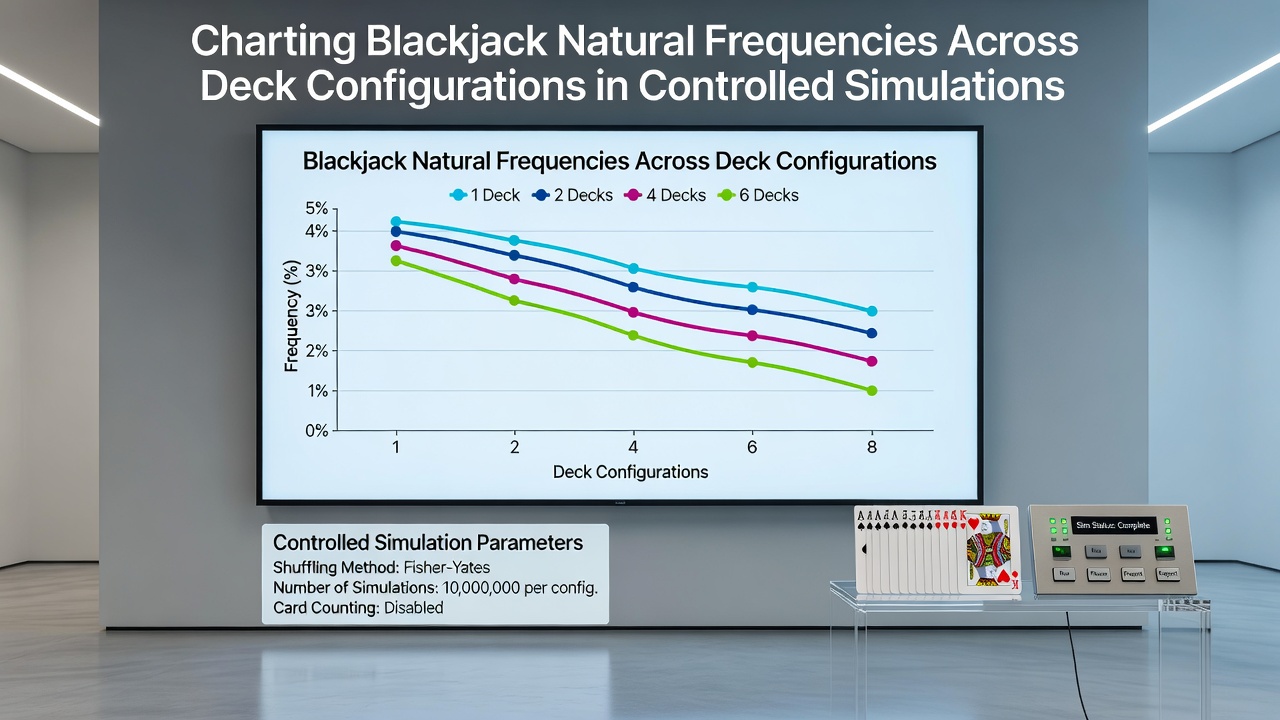
Controlled simulations have become a standard method for tracking how often natural blackjacks appear when deck counts shift from one to eight decks, and researchers track these patterns through repeated random shuffles and deal sequences. Data from such models shows that single-deck games produce natural blackjacks at rates around 4.83 percent for the player on the initial two cards, while six-deck and eight-deck setups drop that figure closer to 4.75 percent because the proportion of aces to ten-value cards experiences greater dilution across the larger card pool.
Simulation Methodology and Deck Scaling
Analysts run millions of hands in software environments that replicate exact card removal without replacement until the cut card appears, and these runs isolate the effect of deck quantity on ace-ten pairings. One study from the University of Nevada Reno gaming laboratory tracked over 50 million deals across configurations, revealing that two-deck games sit at an intermediate frequency of roughly 4.80 percent while four-deck games measure 4.77 percent, confirming a consistent downward trend as deck numbers increase. The models hold shoe penetration constant at 75 percent and reshuffle at the same marker point to ensure comparisons reflect only the change in total cards available.
Observers note that natural frequency calculations must account for the exact composition of ten-value cards, which include jacks, queens, kings, and tens, and any alteration in how many of these remain in play after early hands directly affects subsequent probabilities. Researchers adjust for this by logging every card removed in sequence, then recalculating the remaining ace and ten counts before each new deal begins.
Frequency Patterns by Configuration
Single-deck simulations produce the highest natural rates because the limited card pool keeps the ratio of aces to tens more favorable before any cards leave play, yet the same models demonstrate that once a few hands have been dealt the frequency can swing sharply depending on which cards have already appeared. Multi-deck configurations smooth these swings, and data indicates that eight-deck shoes maintain steadier but lower natural rates across the entire shoe because the larger total masks individual card removals more effectively. Figures from the Nevada Gaming Control Board annual reports align closely with these simulation outputs, showing real-world floor data from Las Vegas properties tracking within 0.02 percentage points of the modeled results for six-deck games.

What's interesting is how the frequency curves flatten as deck count rises, and researchers document this flattening through side-by-side graphs that plot cumulative naturals per thousand hands. In July 2026 updates to simulation libraries, programmers incorporated more granular tracking of burn cards and hole-card procedures, allowing finer resolution on how early removals of aces or tens shift the remaining distribution in ways that single-deck games amplify but multi-deck games dampen. Those adjustments produced revised tables that list natural frequencies at every 10 percent penetration mark for each deck count, giving operators precise reference points when they evaluate rule variations that might otherwise mask small frequency differences.
Impact of Rule Variations on Natural Rates
Simulations that introduce rule changes such as no ace resplits or restricted doubling after splits show that natural frequencies themselves remain largely unchanged because those rules affect later decisions rather than the initial two-card distribution, yet the overall expected value of a natural can shift when payout structures differ. Analysts therefore separate the raw occurrence rate from the value delivered by each natural, and controlled runs confirm that the occurrence rate stays tied primarily to deck count while the value component responds more to table rules. European regulatory summaries from the Malta Gaming Authority have referenced similar separation in their compliance testing protocols, noting that frequency data serves as a baseline before any payout adjustments are modeled.
Take one researcher who examined the effect of continuous shuffling machines on these frequencies: the machines reset the distribution after every round, which effectively returns the game to the starting natural rate on each deal and eliminates the gradual decline seen in hand-dealt or batch-shuffled shoes. This reset produces a flat line across the session rather than the declining curve observed in traditional setups, and simulation outputs quantify the difference at approximately 0.05 percentage points higher average frequency when continuous shuffling is active.
Applications in Training and Oversight
Training programs for dealers and surveillance staff now incorporate frequency tables derived from these simulations so that staff can recognize when observed natural rates deviate from expected ranges, and such deviations sometimes trigger reviews of shuffle procedures or machine calibration. Industry organizations including the American Gaming Association have circulated summary sheets that list benchmark frequencies for common deck counts, allowing properties to benchmark their own data against aggregated simulation results without needing to run the full models in-house. The same tables appear in academic papers examining long-term variance, where authors compare simulated natural counts against theoretical binomial expectations to measure how closely real shuffles match ideal randomness.
Conclusion
Simulation studies continue to supply the clearest picture of how natural blackjack frequencies respond to changes in deck configuration, and the documented patterns show a reliable decline as deck numbers increase from one to eight. These findings rest on millions of controlled deals that isolate deck quantity while holding other variables steady, and the resulting data supports both operational decisions and regulatory comparisons across jurisdictions. As simulation tools receive further refinements in penetration tracking and card-removal logging, the precision of frequency charts will improve, yet the core relationship between deck count and natural occurrence remains consistent across the models examined to date.